FAQs
You are here
Frequently
Asked
Questions
Scientists at The Field Museum are often asked about climate change. Our experts have provided answers to some of the most common questions and important facts about climate change. This information is intended to be a supplement to Climate Change In The Windy City And The World, which is a great source for learning about the basics of climate science and impacts on the Chicago region.
This page will be updated periodically to ensure the information presented is based on the most current and scientifically accurate data available.
If you would like to be updated on the most recent research and news related to climate change, please email catherine.game@chicagowilderness.org to receive the Chicago Wilderness Climate Change Task Force newsletter. This free, bi-monthly, electronic publication is edited by Field Museum staff, and provides summaries of current scientific research and news articles. You can also find links to great education resources and information about local events.
1 What is the difference between weather and climate?
Weather refers to day-to-day changes in the atmosphere. An example would be: “The high temperature in Chicago on Monday, November 13, 2011 was 71°F.”
Climate is the average weather conditions of a specific location over many years, including variations from normal and extreme events. An example would be: “The average high temperature for Chicago on November 13 between 1960 and 2011 is 50°F.”
2 What is global warming and how does it differ from climate change?
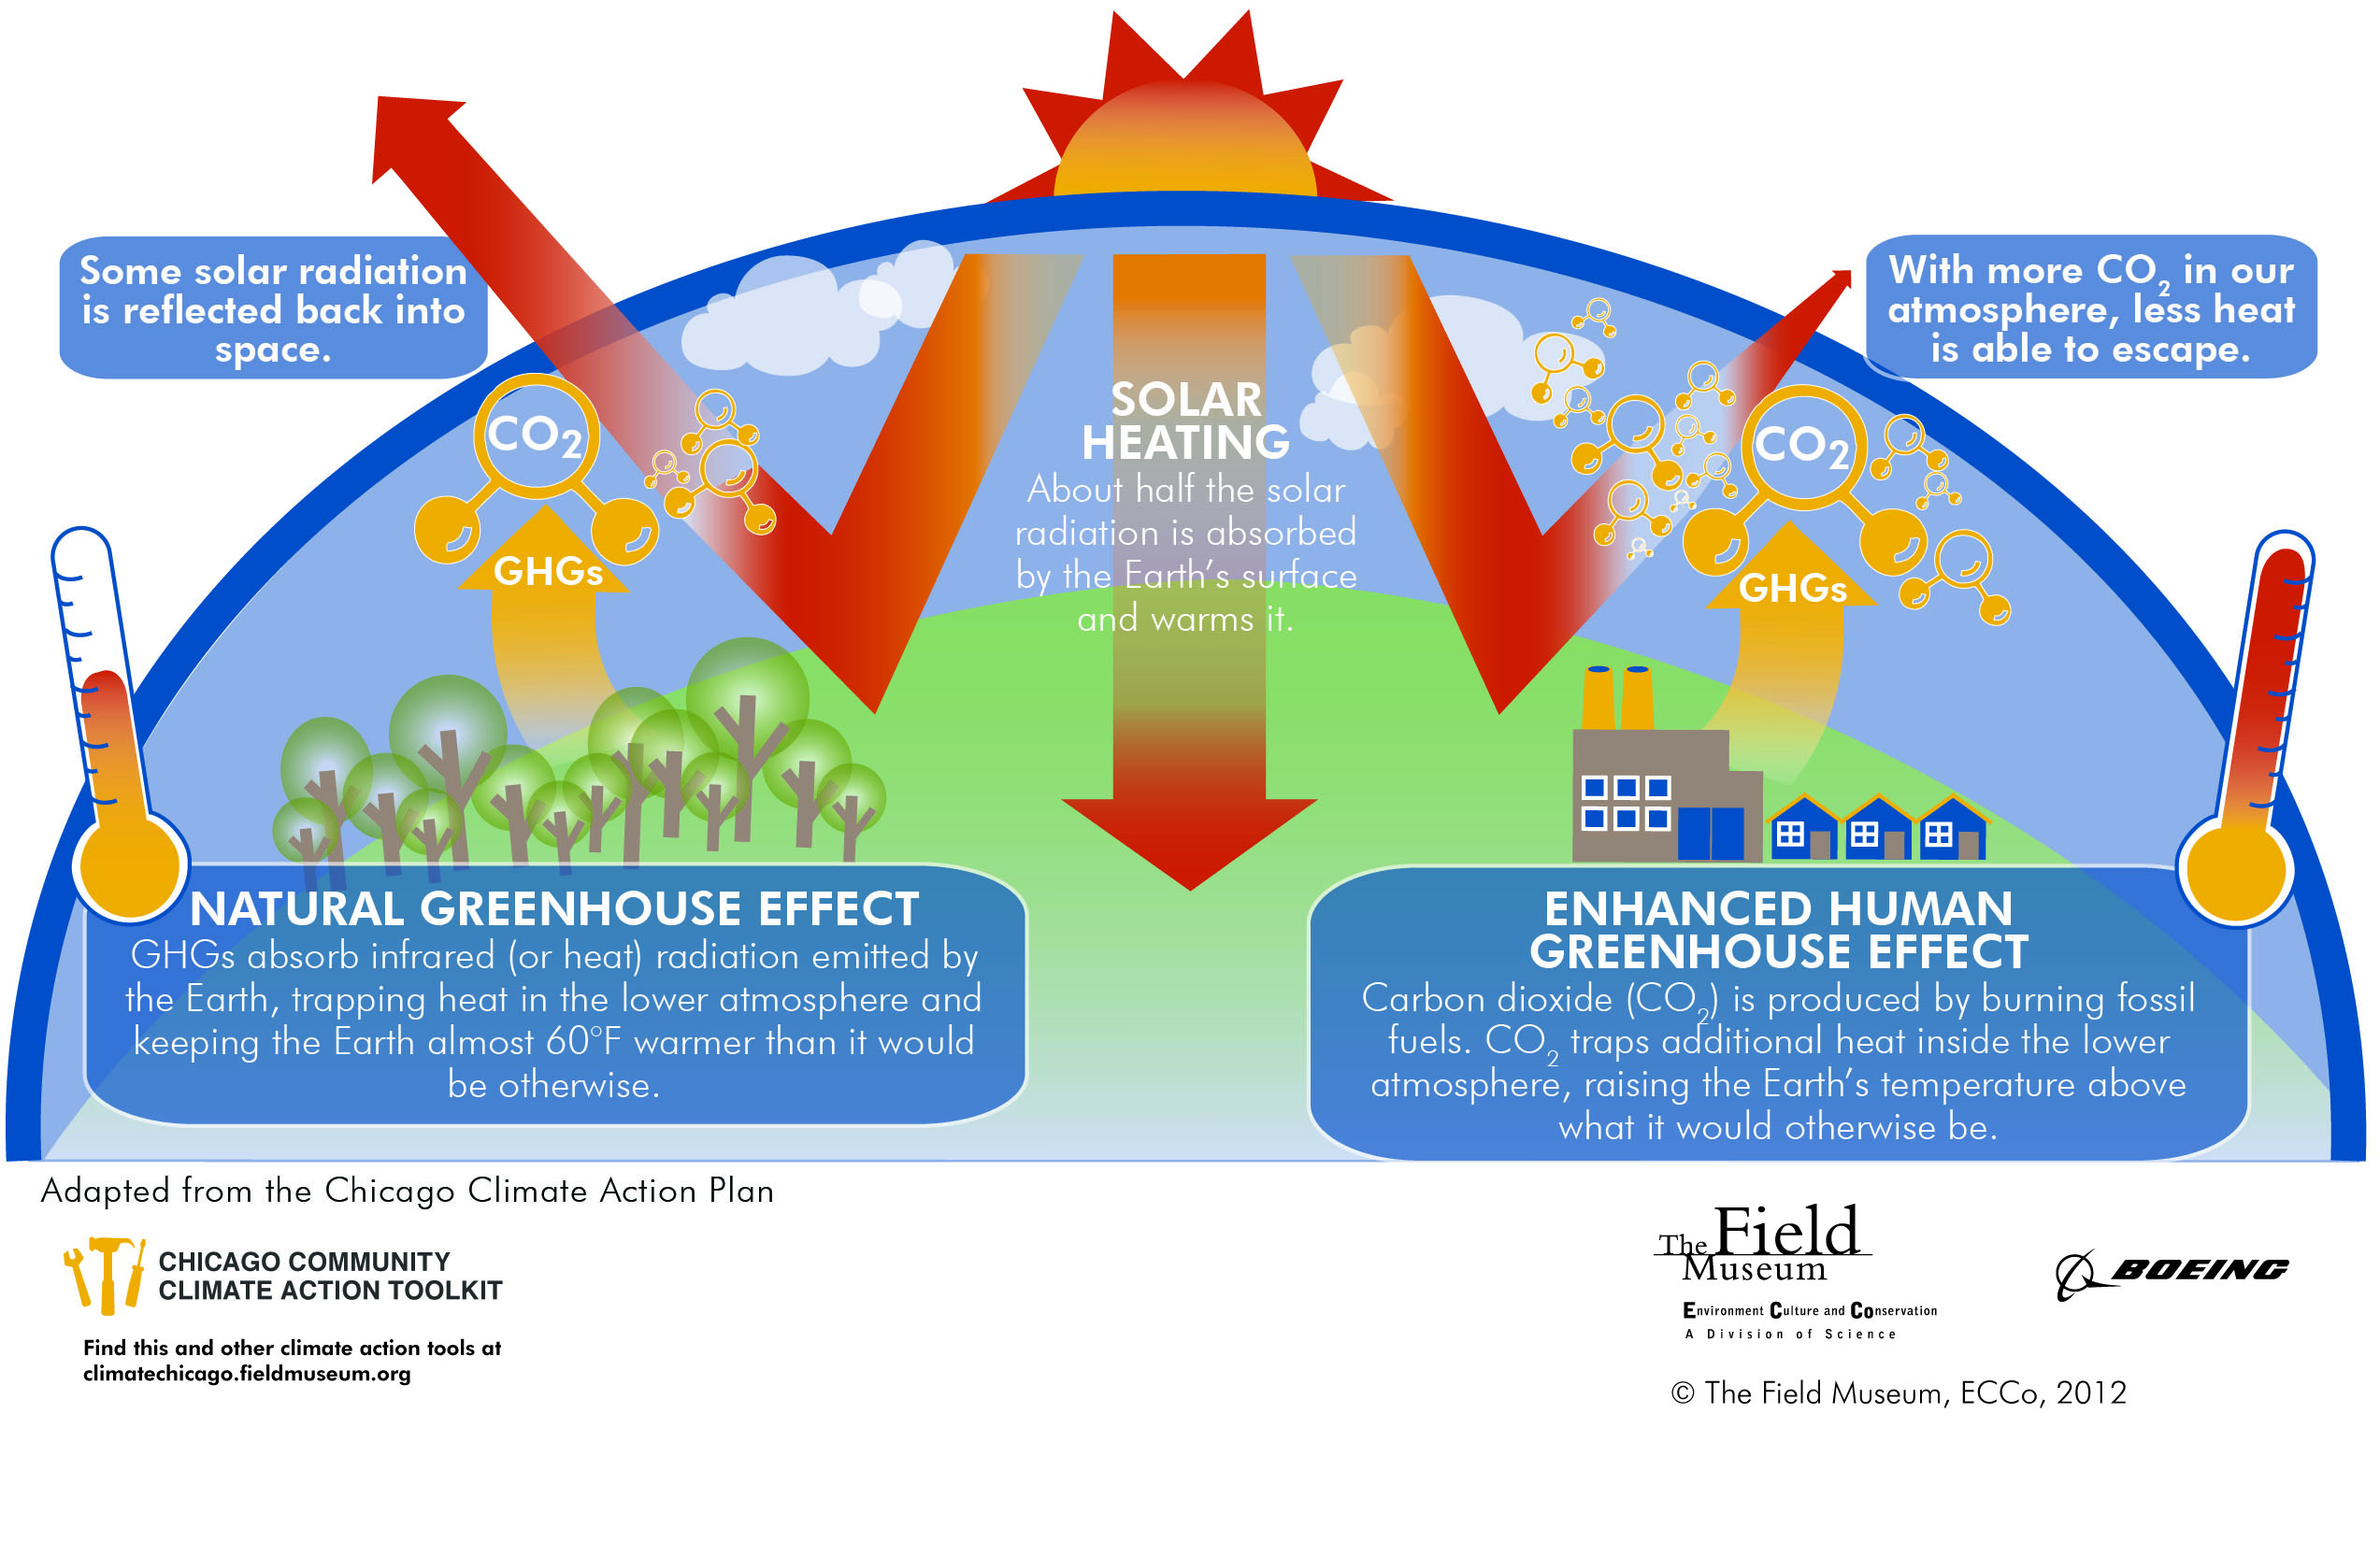
Global warming refers to a rise in Earth’s average temperature. Global average temperature has risen by approximately 1.4°F (0.8°C) since the early 20th century. (Reference 6)
Global warming and climate change are two different, but related, things. An increase in Earth’s average temperature (global warming) has the ability to influence other variables, e.g., precipitation, wind circulation, ocean circulation, and humidity, which are referred to collectively as climate change.
3 What is the connection between ozone and climate change?
Stratospheric ozone is created naturally in the upper atmosphere and creates a protective layer around Earth (the ozone layer), shielding the surface from harmful UV radiation from the Sun. A majority of ozone (90%) is found in the upper atmosphere.
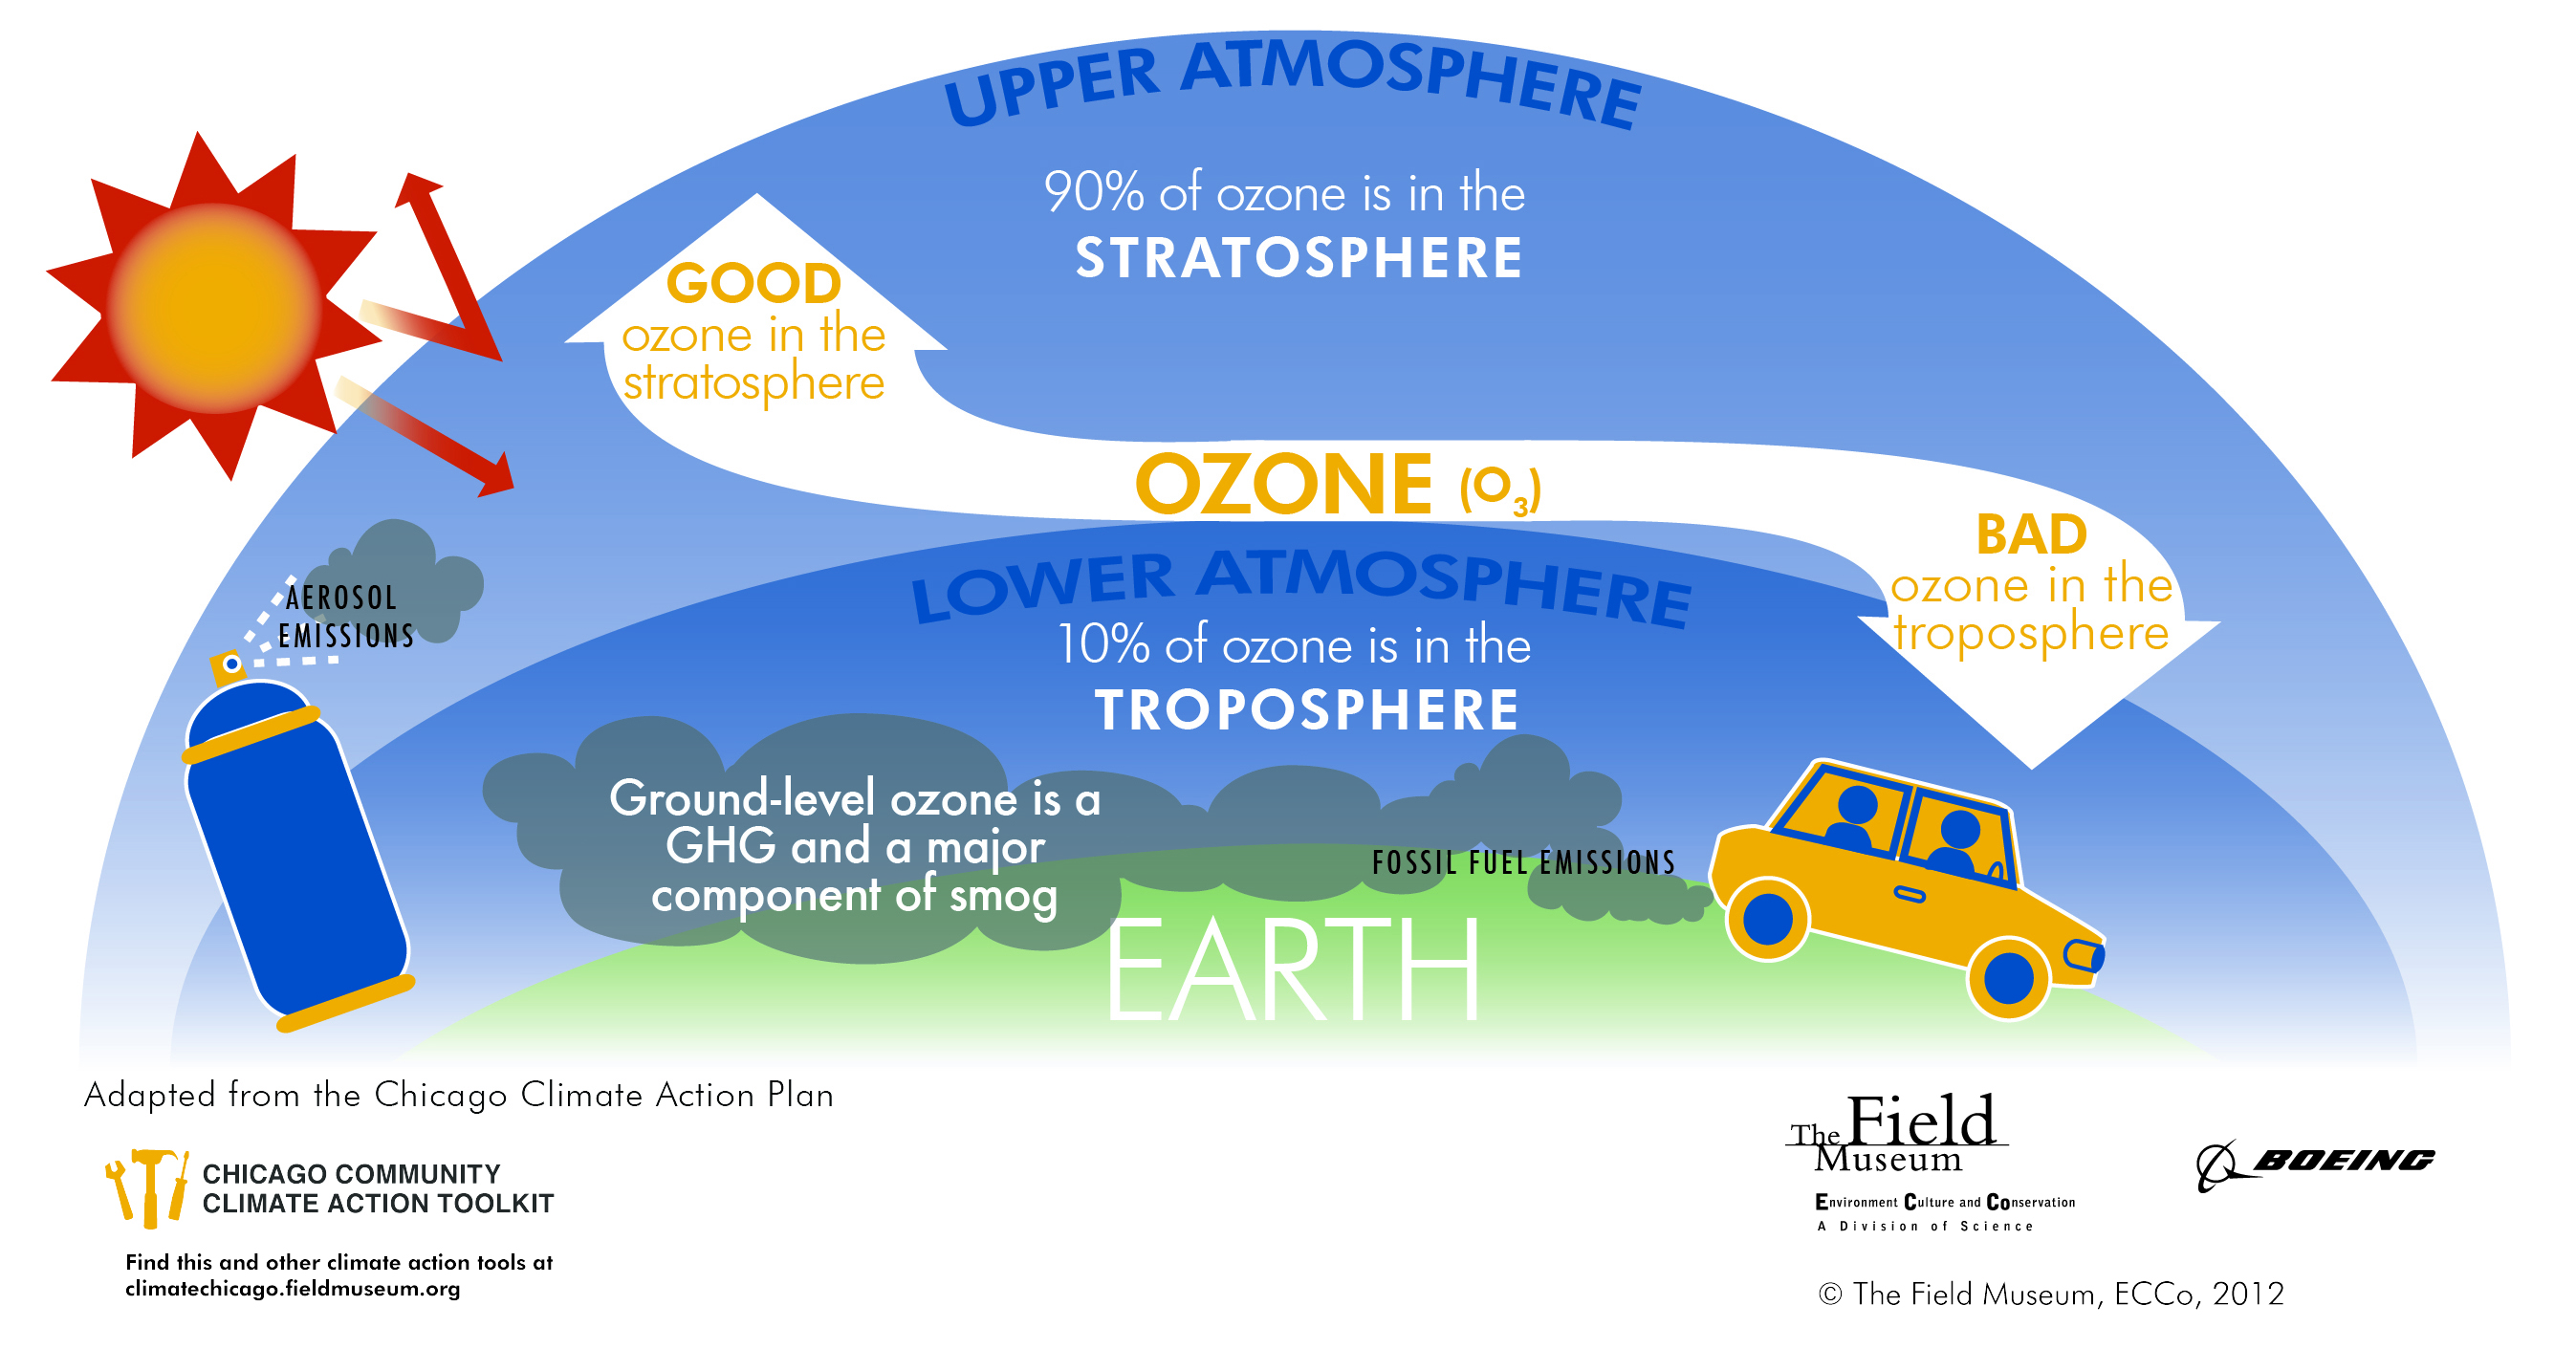
The remaining 10% of atmospheric ozone is located in the troposphere (near the surface), and is produced by the reaction between sunlight and pollutants in the air. Tropospheric ozone is a greenhouse gas and harmful to humans (Reference 7).
As temperatures rise, ground level ozone increases. Ground level ozone is the primary component of smog. So, as the climate warms, health problems associated with smog, like asthma, will increase.
4 Is it true that launching the space shuttle creates a hole in the ozone layer?
No, that is not true. NASA has studied the effects of exhaust from the space shuttle’s solid rocket motors on the ozone. In a 1990 report to Congress, NASA found that the chlorine released annually in the stratosphere would be about 0.25% of the total amount of halocarbons released annually worldwide.
The report concludes that space shuttle launches at the current rate pose no significant threat to the ozone layer and will have no lasting effect on the atmosphere. The exhaust plume from the shuttle represents a trivial fraction of the atmosphere, and even if ozone destruction occurred within the initial plume, its global impact would be inconsequential.
Further, the corridor of exhaust gases spreads over a lateral extent of greater than 600 miles in a day, so no local “ozone hole” could occur above the launch site. Images taken by NASA’s Total Ozone Mapping Spectrometer at various points following shuttle launches show no measurable ozone decrease. (Reference 8)
5 What is the connection between climate change and acid rain?
Acid rain is a broad term referring to a mixture of wet and dry material deposited from the atmosphere containing higher than normal amounts of nitric and sulfuric acids. Acid rain formation results from both natural sources, such as volcanoes and decaying vegetation, and human-made sources, primarily emissions of sulfur dioxide (SO2) and nitrogen oxides (NOX) resulting from fossil fuel combustion. NOX is also a greenhouse gas that can trap heat and warm the Earth. In the United States, roughly 2/3 of all SO2 and 1/4 of all NOX come from electric power generation that relies on burning fossil fuels, like coal. Burning fossil fuels release acid polluntants. These pollutants are carried far from their sources by wind, and depending on the weather, the acid pollutants react with water and fall to the Earth in wet form (acid rain, snow, mist or fog) or in dry form (acid gases or dusts). (Reference 9-10)
Changes made to the 1990 Clean Air Act, which put a permanent limit on the amount of SO2 (about 50% below 1980 levels) and NOX that electric power plants are allowed to emit per year nationwide, reduced emissions of acid rain pollutants in the US. However, as long as we continue to burn fossil fuels, there will be effects on the environment—particularly the acidification of lakes, streams and soils, and the altering of soil chemical composition so that organisms have a harder time growing. (Reference 11) These effects are now being compounded by climate change. Acid rain has the most severe impacts in high elevation forests. These areas are also sensitive to changing climate because many are dominated by snow. Climate change is decreasing snow pack accumulation, so the hydrology—or water cycle—is completely changing in the high elevation forests. Recent research suggests that warmer temperatures increase the breakdown of soil organic matter, which has accumulated large quantities of nitrogen from acid rain inputs. As a result, a warming climate is causing nitric acid to be leached from soil and further acidify the soil and water. (Reference 12)
There are a number of ways that climate change may impact extreme weather events. For example, it could influence the frequency (how often events occur) or severity (bigger and more intense) or increase the damage caused by an event. While it is not possible to link one individual event directly to climate change, the overall pattern of more extreme events that we are seeing today is exactly what global climate models predict for a warming world.
There is evidence to suggest that a warming world will bring with it an increase in extreme events, and also increased damage resulting from them. Why would this be? First, a warmer world holds more moisture in the atmosphere, which then comes down in the form of heavier rain or snowstorms. As wind and circulation patterns change, some areas will experience many more storms, while others will experience fewer. The outcome will be that different areas will simultaneously experience floods, while at the same time other regions will be facing severe drought (which is already evident).
Second, rising sea surface temperatures can potentially influence the intensity of tropical cyclones and hurricanes that form over the ocean. Third, extreme events could worsen existing environmental stress that a region is experiencing and increase the amount of damage caused by a particular extreme event. For example, if a region has experienced a wetter than usual winter or spring, and then has a major storm event where a large amount of rain falls during a short period of time, the flooding and damages that result will likely be worse because of the generally wetter conditions to begin with. The same situation could be applied to a drier than usual spring leading into a more severe summer drought than what otherwise would have occurred.
There is high confidence that both maximum and minimum daily temperatures have increased on a global scale due to the increase of greenhouse gases, according to a Special Report on Managing the Risks of Extreme Events and Disasters to Advance Climate Change (SREX) released in November 2011 by member governments of the Intergovernmental Panel on Climate Change (IPCC). The assessment concludes that it is virtually certain that on a global scale hot days become even hotter and occur more often. Likewise, heavy precipitation will occur more often. Changes in other extremes, such as more intense and longer droughts, have been observed in some regions, but the assessment assigns medium confidence due to a lack of direct observations and a lack of agreement in the available scientific studies.
Scientists are currently still unsure whether a warming climate would result in an increase in the frequency of hurricanes and other tropical cyclones, but there is a stark warning for the northern hemisphere, and areas of Europe and North America where currently hurricanes hardly ever happen. Based on observations, there has been a “poleward shift” in the pattern of the storms, which will mean severe storms are more likely to strike areas such as New York and the Atlantic coast of Europe. (Reference 13)
7 What are climate models? How are they used and what can they say?
Climate models are mathematical representations of Earth’s climate system, used to get a picture of what the atmosphere and Earth may look like some time in the future in response to natural and anthropogenic processes. (Reference 14)
There is confidence that climate models provide credible quantitative estimates of future climate change, particularly at continental scales and above. This confidence comes from their ability to reproduce observed features of current climate and past climate changes, their success in making predictions that have been subsequently confirmed by observations, and the foundation of the models based on accepted physical principles. (References 15-16)
Despite the science community’s confidence in climate models, models still show significant errors, mainly resulting from the assumptions that all climate models must make about how the Earth works. The complex and non-linear nature of climate means there will always be a process of refinement and improvement. However, models have evolved to the point where they successfully predict long-term trends and are now developing the ability to predict more chaotic, short-term changes. While it is not possible to precisely project all aspects of future climate (in particular because the magnitude of future impacts is based in large part on the outcomes of social and political decisions that are difficult to anticipate), most climate scientists argue there is enough reliable information on future climate trends and patterns to begin implementing robust adaptation strategies (Reference 17)
8 What local impacts are anticipated in the greater Chicago metropolitan region due to climate change?
Based on downscaled models for this region, which is a strategy that connects global scale predictions and regional dynamics to generate regionally specific forecasts, the following impacts are expected to occur: (Reference 18)
- “Migrating seasons” for regional climates: By century’s end, winter is forecasted to feel similar to Pittsburgh and summers similar to Knoxville or, under high emissions, Baton Rouge.
- Temperature increase: Under high emissions, the Midwest may experience 45-85 days over 95° F by century’s end.
- Heat-related morbidity: By 2085, there may be 450-1,200 heat-related Chicago metro-area deaths per year.
- Changed precipitation patterns: As compared to the 1961-1990 average, spring and winter in 2070 could have 20-35% more.
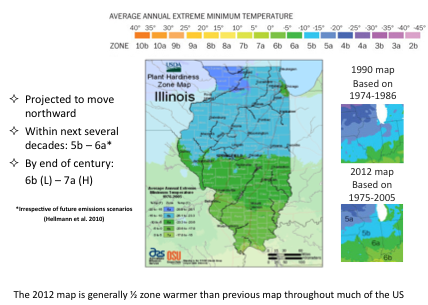
- Plant Hardiness Zone shift: The Midwest’s zones have shifted and could continue to shift ½ to 1 zone every 30 years. From 1990-2006, parts of Northern Illinois shifted from a 5 to a 6 hardiness zones, representing a 10° F range change in the lowest temperature of the year. Since then, the region has become an additional ½ zone warmer--as shown by this map just released in 2012 (click on image to see larger version).
- Great Lake impacts: Modeling future lake level projections is extremely complex. The most recent research shows a range of possible conditions, ranging from a slight decrease to a slight increase in Lake Michigan during this century (Reference 19). Additionally, the Great Lakes could experience an increased likelihood of extreme storms.
9 How will these changes affect the nature and wildlife of this region?
Climate change may continue to alter many aspects of life in Chicago. For examples, as the region becomes warmer, drier and experiences more extreme events, the following impacts are likely to occur:
(References 20-22)
- Animals and plants become stressed from too much heat and too much or too little water;
- Rivers, lakes and wetlands become more polluted from increased stormwater run–off, which picks up sewage, garbage, fertilizer etc. that then flows into these waterways;
- Invasive species and pests become more prevalent;
- Decoupling of important life cycle events occur.
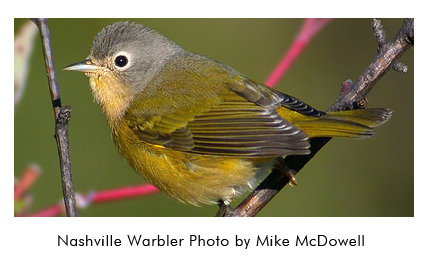
This last example, the decoupling of important life cycle events, such as the timing of migrations and flowering, are likely to occur due to organisms responding differently, and at different rates, to changes in climate. Desynchronization of these relationships will have important consequences for how organisms at different levels of the food web interact with one another. For example, based on observations made by Eric Gyllenhaal (Reference 23) in spring 2011, Elm leaf beetles, American Elm trees and Nashville warblers have a tightly synchronized food web interaction in this region. As new leaves appear on the trees in the spring, Elm leaf beetle larvae emerge at the same time to take advantage of this food resource. Migratory warblers typically appear at this time, feeding on the larvae and acting as a natural pest control for the Elms. Spring green-up, however, is already shifting in this region, evidenced by Oak trees now leafing out approximately 2 weeks earlier. As the warm-up continues to advance, and organisms such as trees and insects responding to temperature cues begin to emerge earlier, a mismatch between food availability and that of avian migratory timing could take occur. This would impact the insectivorous migrant birds, and their ability to provide the form of natural pest control for the Elm trees.
10 How will these changes affect the people who live in the greater Chicago region?
People also rely on the many benefits that nature and wildlife provide. These benefits are called ecosystem services, and include things such as providing clean air and water, stormwater abatement, carbon storage, along with cultural and aesthetic values. Additionally, scientists project increases in:
- Heat–related diseases like heart attacks and asthma;
- Flooding, affecting residences, public transportation and bridges;
- Electricity shortages and changes in energy demands;
- Municipal costs, such as landscaping, road maintenance, and emergency response.
By reducing your own carbon footprint, and by helping our communities, natural areas, and green spaces adapt to the changes that are already occurring—and will continue to occur—we can lessen the severity of these impacts and foster a closer connection between ourselves and the natural systems we are so intrinsically linked to.
11 What is meant by the terms “climate variability” and “climate change”?
Earth’s climate has been changing for billions of years, and it varies on seasonal, annual, decadal, and longer timescales. Due to these natural variations that occur, people who study the climate look at 30 years of weather data at a minimum- and typically much longer- when they want to see the climate pattern for a region.
Climate variability refers to variations in climate on time scales of seasons to decades and is generally controlled by natural ocean and atmospheric processes like the El Niño Southern Oscillation, Arctic Oscillation, and the North Atlantic Oscillation (References 1-3)
Climate variability explains how one winter can be cold and snowy, while the next is milder; or, how one decade is much drier than normal.
Climate change describes long-term (decades or longer) and persistent changes in the climate of a location and occurs because of natural and/or anthropogenic (human) processes. Climatology, the study of climate science, looks at a minimum of 30 years—or 3 decades—of weather pattern data to describe the climate, or change in climate, of a particular region.
Natural processes that can produce a change in Earth’s climate include variations in solar energy received by Earth arising from variable solar activity or slow orbital changes (Reference 4).
Anthropogenic, or human, processes that can produce a change in Earth’s climate include the burning of fossil fuels (which releases greenhouse gases) and land use changes like urbanization, deforestation, and desertification (Reference 5)
References
- NOAA El Niño Southern Oscillation (ENSO)
- Arctic Oscillation (AO)
- North Atlantic Oscillation (NAO)
- NASA (“Solar Variability: Striking a Balance with Climate Change”)
- EPA (“Recent Climate Change”)
- NCDC (“Global Climate Change Indicators”)
- NOAA Science Ozone Basics
- http://www.nasa.gov
/centers/kennedy
/about/information
/shuttle_faq.html#5 - http://www.epa.gov
/acidrain/what/
- http://www.epa.gov
/airquality/peg_caa
/acidrain.html - http://www.news.cornell.edu/
stories/Jan08/acidrain.climate.
aa.html - http://dsc.discovery.com
/earth/im-interview
/acid-rain-driscoll.html - Download the full IPCC report
- NOVA Science (“Modeling Climate”)
- IPCC (“Climate Models and their Evaluation”) PDF
- EPA Report (“Climate Models”)
- Skeptical Science: How reliable are climate models?
- Climate Change and Chicago: Projections and Potential Impacts – Chapter 5 – Ecosystems
- Lofgren, B.M., et al., Effects of using air temperature as a proxy for potential evapotranspiration in climate change scenarios of Great Lakes basin hydrology, J Great Lakes Res (2011), doi:10.1016/j.jglr.2011.09.006
- Biodiversity Recovery Plan Climate Change Update Addendum (Draft)
- Climate Action Plan for Nature
- Hellmann, J. J., K. J. Nadelhoffer, L. R. Iverson, L. H. Ziska, S. N. Matthews, P. Myers, A. M. Prasad, and M. P. Peters. 2010. Climate change impacts on terrestrial ecosystems in metropolitan Chicago and its surrounding, multi-state region. Journal of Great Lakes Research 36(2): 74-85.
- http://neighborhoodnature.
wordpress.com/2011/05
/04/look-whats-
falling-from-our-elm-trees/